|
start
>
5. Nutrient Transport Processes
>
5.1 Soil => Root Surface
>
5.1.2 Diffusion
|
 back
forward
back
forward 
|
|
|
|
|
Diffusion refers to the movement of particles driven by the tendency to equalize concentration
differences, based on Brownian molecular motion.
In soil, this diffusion flux (FD)—unlike in liquids—depends not
only on the concentration gradient
(dc/dx) and the diffusion coefficient in solution (Dₗ), but also on soil factors: buffering capacity
(b),
tortuosity factor (f), and water content (θ). As a result, the diffusion coefficient in soil can
be as low
as 1/10,000 of the diffusion coefficient in solution. Therefore, the diffusion coefficient in soil is
referred to as the "effective" diffusion coefficient (Dₑ).
FD= dc/dx De
De = DL T f 1/b
b = c/cL
If the supply via mass flow does not lead to an accumulation of ions in the root zone, and the plant
simultaneously has the ability to lower the concentration of the soil solution, then the equilibrium
between sorbed ions and ions in the soil solution is disturbed. This causes ions to move from more
distant soil regions toward the root. The extent of the "depletion zone" is a function of
time and the
effective diffusion coefficient (dx = √(Dₑ · t)).
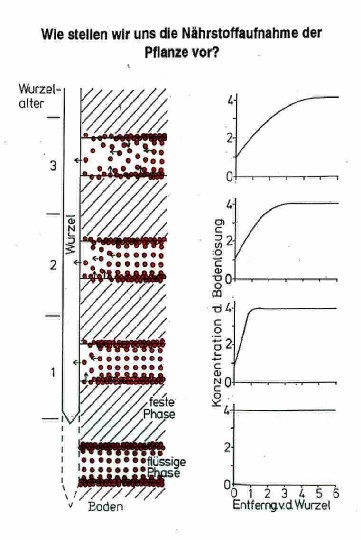 The figure above schematically illustrates the process of supply via diffusion over time:
- The plant lowers the concentration
of the soil solution at its surface.
- To maintain equilibrium, sorbed ions
are desorbed from the solid phase.
- In the soil solution, ions are transported
along the concentration gradient toward the root.
- "Depletion profiles" are
formed.
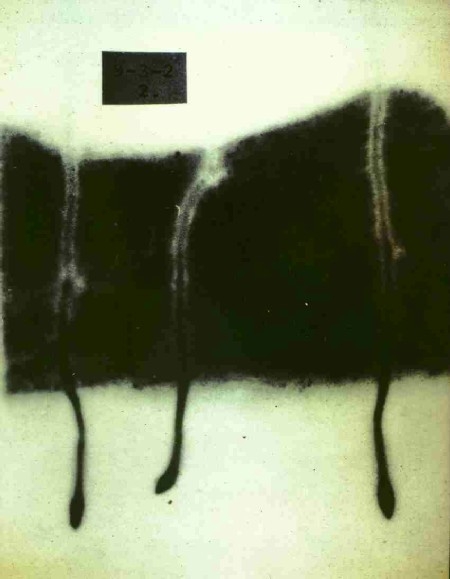
The following two images are autoradiograms ("X-ray images" produced using
isotopes; image
height approx. 10 cm) of the root environment:
- In agar, which has no sorption sites
for phosphate.
- In soil, which sorbs phosphate.
It becomes evident that in a sorbing substrate, the depletion zone is very narrowly confined around
the root. Consequently, only a small portion of the total soil volume contributes to the phosphorus
supply. |
|
Diffusion coefficients in solution (Dₗ, water, 25°C) for selected
ions, compared with common
ranges of diffusion coefficients in soils (Dₑ)
|
Ion
|
DL, cm²
/s
|
De cm²/s
|
|
K+
|
1.98 10exp-5
|
10exp-7 bis
10exp-8
|
|
H2PO4
|
0.89 10exp-5
|
10exp-8 bis
10exp-11
|
|
NO3
|
1.90 10exp-5
|
|
|
|
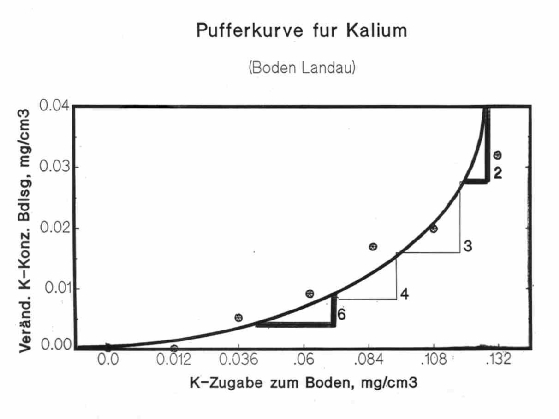
The "buffering capacity" of a nutrient in soil refers to the ratio of ions
adsorbed to the soil's solid
phase to ions present in the soil solution (µmol/cm³ soil vs. µmol/cm³ solution). Thus, buffering
capacity is a measure of a soil's ability to store nutrients in adsorbed form.
The figure below shows the potassium buffering curve for a loess soil. Increasing
amounts of
potassium were added to it, and the change in soil solution concentration was measured. It can be
observed that the buffering capacity decreases with increasing potassium application, meaning that
proportionally less K is adsorbed. Consequently, Dₑ and thus the nutrient's mobility in
the soil
increase.
Merke: in unseren Böden wird
von den Anionen Phosphat an Bodenkolloiden
sorbiert; Nitrat, Sulfat, Molybdat etc. unterliegen diesen Einflüssen in weit geringem
Umfang. Kationen werden mit austeigender Wertigkeit zunehmend sorbiert,
innerhalb der gleichen Wertigkeit mit zunehmendem Ionendurchmesser. Spezielle
Bindungsstellen exitieren z.B. für Kalium und Ammonium in den Zwischenschichten
von illitischen Tonmineralen.
|
|
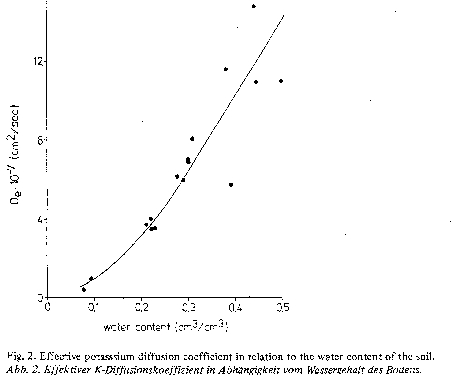
Difusionskoeffizienten vom Wassergehalt für einen Lössboden.
The water content (θ) is expressed in (cm³ water)/(cm³ soil),
typically ranging between 0.05 and
0.45. Consequently, Dₑ, as a measure of a nutrient's mobility, depends on the soil water content
(see also the effects on the tortuosity factor). The figure below shows the dependence of the
effective diffusion coefficient (Dₑ) on water content for a loess soil.Difusionskoeffizienten
vom
Wassergehalt für einen Lössboden.
The water content (θ) is expressed in (cm³ water)/(cm³ soil),
typically ranging between 0.05 and
0.45. Consequently, Dₑ, as a measure of a nutrient's mobility, depends on the soil water content
(see also the effects on the tortuosity factor). The figure below shows the dependence of the
effective diffusion coefficient (Dₑ) on water content for a loess soil.
The figure below shows the dependence of the effective diffusion coefficient (Dₑ)
on water content
for a loess soil.
|
|
The tortuosity factor (f) represents the ratio between the shortest (straight-line)
distance for an ion
to travel between two points and the actual path length it must follow. Therefore, f always ranges
between 0 and 1. In a given soil, the tortuosity factor is highly dependent on soil water content.
This is because as larger pores drain, the available flow pathways become more restricted and
convoluted, leading to greater "detours." |
|
|
|
|