|
start
>
4. Plant Nutrient Demand
>
4.2 Total Demand
>
4.2.2 Vegetables
|
 back
forward
back
forward 
|
|
|
|
|
The most extensive data on nutrient requirements exists for vegetables. The reasons
likely include:
- The high temporal consistency of
cultivated species for (inter-) national markets and their
economic significance.
- The fact that environmental aspects
of open-field production play a role due to high intensity
compared to ornamental plants on confined space and in greenhouses.
|
|
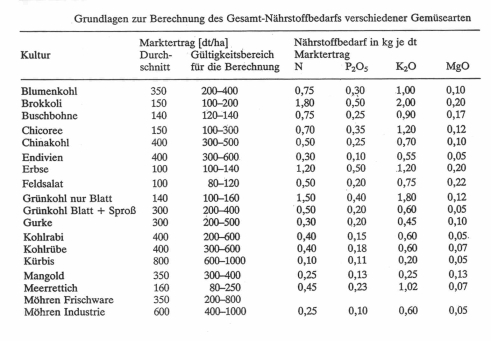
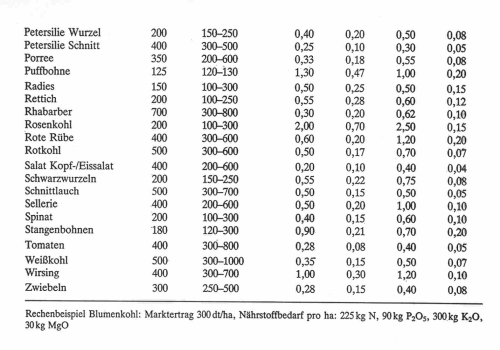
The table below provides the total nutrient requirement for the main vegetable crops
grown in open
fields in Germany. This table is particularly useful because it:
- Gives information on the average
marketable yield and the validity range of the requirements,
- And states the nutrient requirement
per decitonne (100 kg) of marketable yield.
This makes it applicable to a wide range of information scenarios. However, I am always
bothered
by the presentation of P, K, Ca, Mg, etc., in their oxide forms. We know that these often do not
exist in the soil in this form, and they are certainly not taken up by plants in this form.
|
|
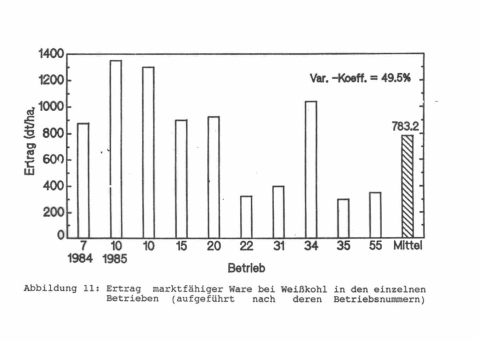
It is common practice to estimate nutrient requirements using "average yields"
or "target yields"
from multiple farms, a region, or an advisory group. However, the following figures illustrate that
this
approach can lead to significant errors. The following diagrams show how widely white cabbage
yields can vary between different farms.
Conclusion: Averages are better than
no information, but farm-specific
information is very valuable. This, however, presupposes plot-specific
record-keeping. |
|
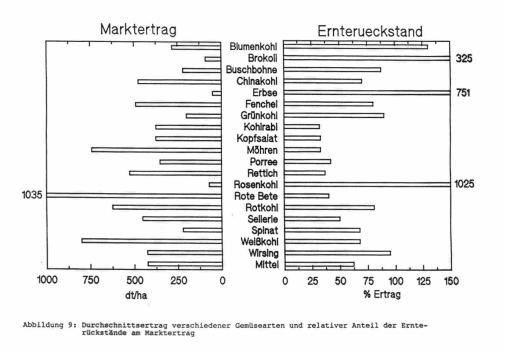
To determine the fertilization rate, knowledge of the crop's total nutrient requirement
is essential.
However, it is also interesting and important to know what proportion of the total plant constitutes
the harvested product (yield). This significantly influences what portion of the nutrient requirement
is
removed from the field with the harvested product. The figure below shows the marketable yield
and, expressed relative to it, the proportion of harvest residues. The range of both values is
enormous and depends, among other factors, on which plant part serves as the yield (see also
figures in the "Total Requirement" section).
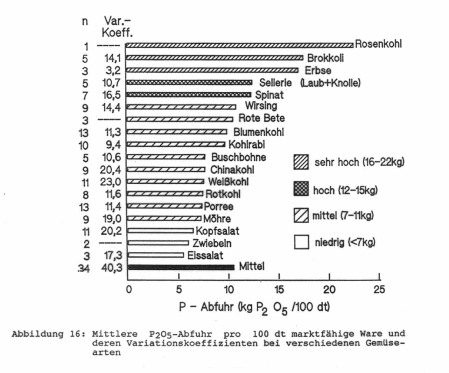
From the above, it follows that the proportion of nutrients taken up and contained
in the yield can
also be expected to vary greatly among different vegetable species. This is because the optimal
potassium content of a plant varies far less than yields do (potassium content ranges from 20 –40
g/kg dry matter, while yields range from 80–1,000 dt/ha). For this reason, it is useful to examine
nutrient removals for different vegetable species when normalized to the same marketable yield.
This provides insight into their "nutrient demand" and, potentially, the expected yield response
to
fertilization.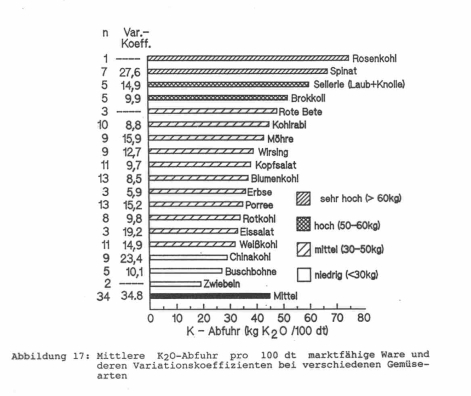
|
|
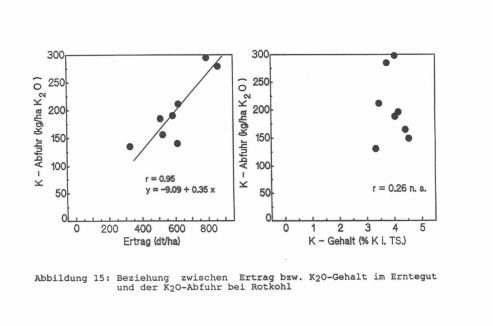
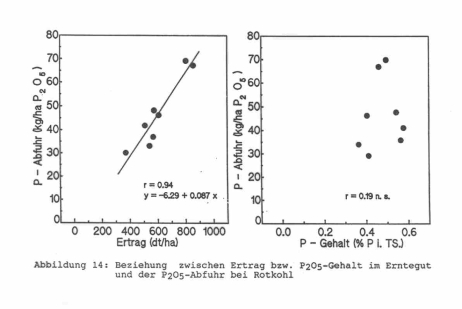
The underlying philosophy for estimating nutrient requirement based on yield is the
assumption of
proportionality: if you know the yield, you can calculate the requirement (or the nutrient removal
with the harvested product). One might be tempted to use the nutrient concentration in the plant (if
it is easy to measure or measured routinely) to determine nutrient removal.
The figures below show that for red cabbage (approx. 50% harvest residues, approx.
50%
marketable yield), the first assumption holds true, but the second does not. This is surprising, as
nutrient concentration is indeed part of the calculation for nutrient removal. So, what is the reason
for this discrepancy?
|
|
Greenhouse production is generally characterized, compared to open-field cultivation,
by:
- a significantly higher production
intensity on smaller areas, and
- in part, the cultivation of vegetable
species not suitable for outdoor production in Germany (at
least during certain production periods).
Therefore, data on nutrient requirements, removals, and uptake are often expressed
per square
meter. Converting from g/m² to kg/ha is easily done by multiplying by a factor of 10 (e.g., 35 g/m²
=
350 kg/ha).
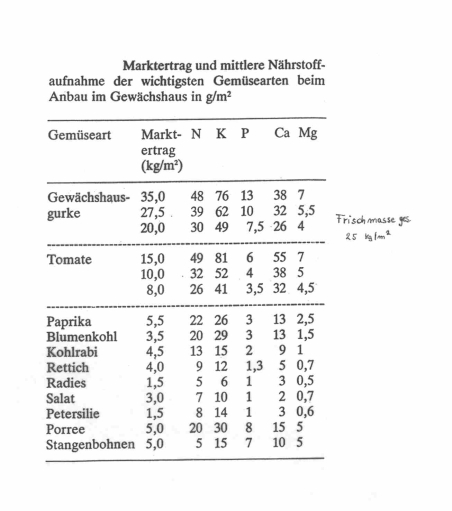
The tables below show the nutrient removals (or nutrient amounts taken up) for various
crops,
planting densities, and yield levels.
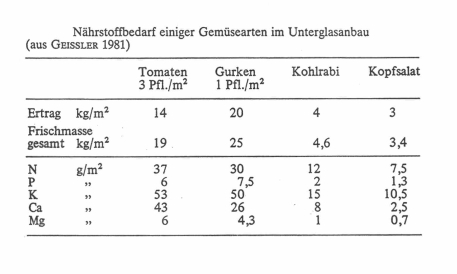
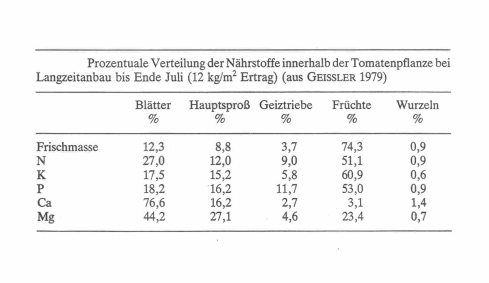
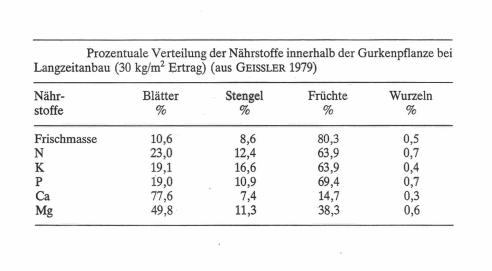
When considering these figures, one should be aware that the achievable yields in
a greenhouse
depend heavily on the available technology and the input of production factors. Yields of 50 kg of
tomatoes/m² are entirely possible. The distribution of absorbed nutrients in tomato and cucumber
plants is shown in the two tables below. 60- 80% of the applied nutrients are found in the
harvested products.
|
|
|
|
|